
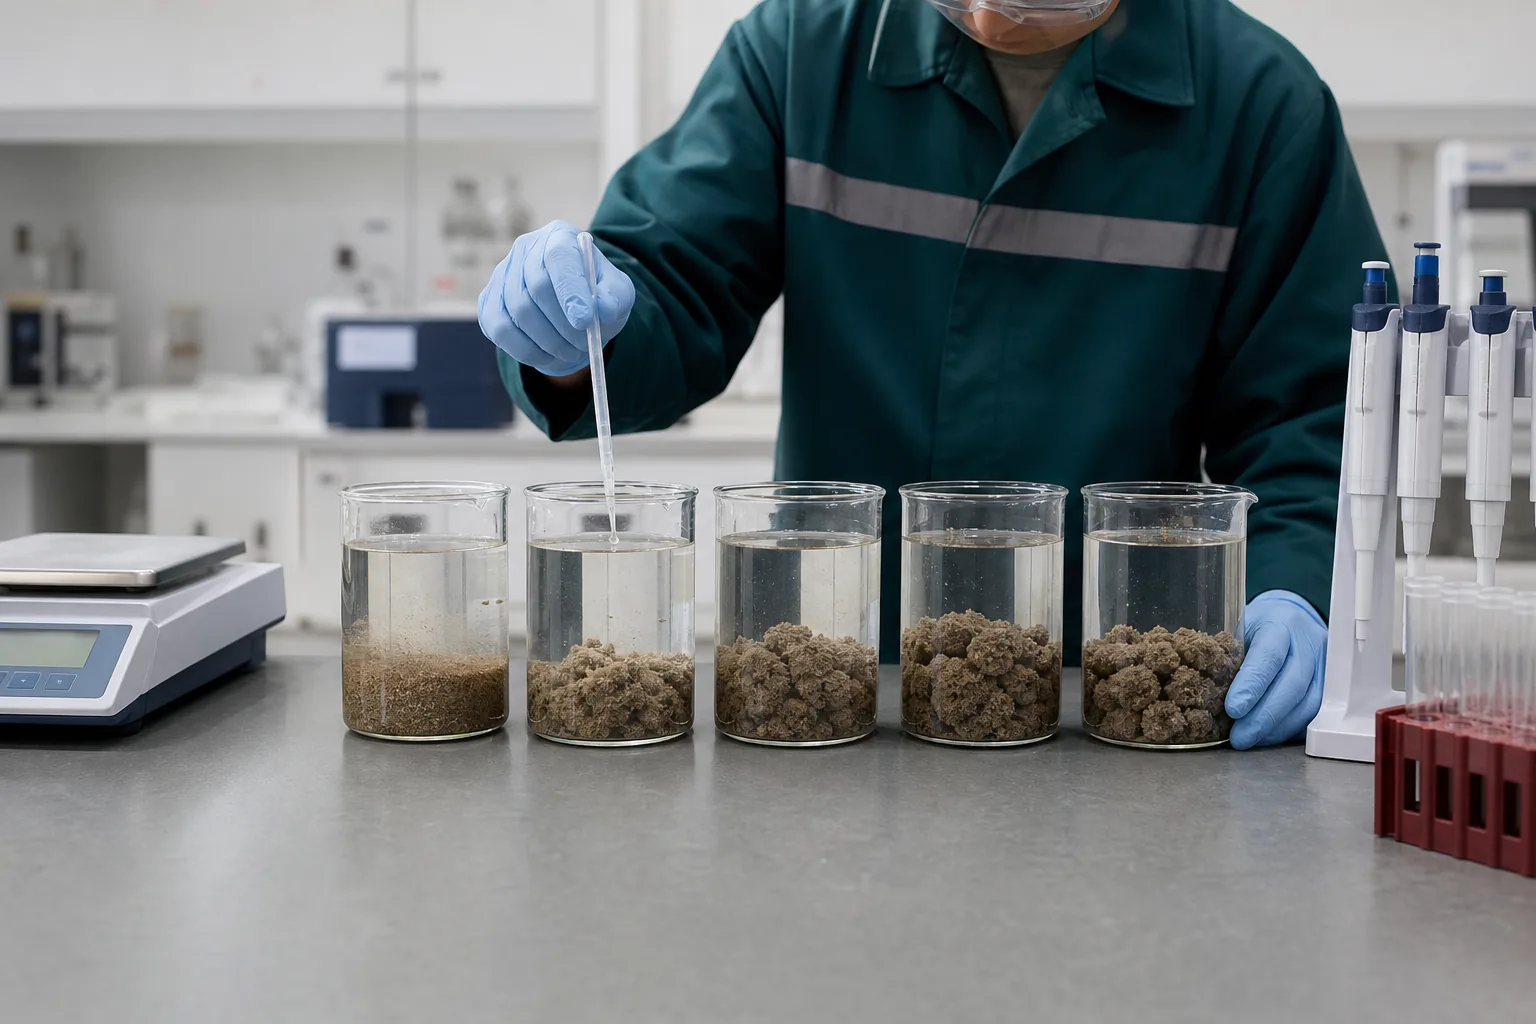
Treat charge density as a test variable
Charge density expresses the relative positive functionality along the polymer chain, but a numeric label alone cannot predict a plant result. Sludge surface chemistry, extracellular material, mineral content, salinity and upstream coagulants all affect demand.
Begin with a bracket of low-to-high candidates appropriate to the feed, not a single assumed grade. Hold preparation and active dose constant while observing response.
Read underdose and overdose
Underdose often leaves fine particles, slow water release and poor capture. As dose enters a useful window, floc formation and drainage improve. Beyond that window, excess polymer may produce sticky sludge, poor cake release, cloth blinding or renewed turbidity.
Use small dose steps around the turning point. Record the full curve instead of reporting only the visually best beaker.
Account for sludge composition
Waste activated and digested biological sludges often need a different cationic range than primary-rich or mineral-rich blends. Industrial biological feeds can change with production and cleaning chemistry.
Segment materially different feeds and preserve total solids, volatile solids, pH and conductivity in the test sheet. A seasonal re-screen may be more economical than forcing one charge profile across every condition.
Apply equipment shear
Transfer leading candidates into representative shear. A centrifuge feed zone can break a floc that looked excellent after gentle mixing; a belt press can expose permeability and release problems not visible in settling tests.
Compare cake solids and capture together. Raising charge or dose to chase dryness can increase losses or chemical cost.
Write the selection record
Record product code, lot, charge family, active content, solution recipe, active dose, injection point and equipment settings. Define the feed window in which the result was achieved.
Use that record with the supplier specification checklist so replenishment is tied to verified performance.
Use charge with molecular behavior
Charge density and molecular profile interact. A higher charge can improve initial destabilization yet a different chain architecture may be needed to create a floc that survives the real mixing and separator. Do not treat charge percentage as a complete grade specification.
Carry at least two candidates with similar charge but different performance profiles when the equipment imposes severe shear or permeability requirements. Their comparison reveals whether the remaining limitation is charge demand, bridging, activation or mechanics.
Define triggers for re-screening
Re-screen when sludge blend, digestion, salinity, upstream coagulant, production chemistry or dewatering equipment changes materially. A sustained shift in dose, centrate solids, filtrate clarity, cake release or wash demand can also indicate that the approved window no longer fits.
Use control charts or consistent shift records where available. A deliberate short trial is usually more informative than gradually increasing polymer while several uncontrolled variables continue to move.
Interpret charge measurements carefully
Zeta potential, streaming-current response or titration can support a screening hypothesis, but none of them replaces separator testing. Sampling, dilution, particle population and measurement method affect the result, and the optimum dewatering condition may not correspond to complete electrical neutralization.
Use charge-related measurements consistently across candidates and relate them to floc strength, water release and capture. Their value is highest when they explain a measured process response, not when a single laboratory number is used as an automatic grade selector.